How to set up Google Analytics for advanced marketing insights
9 min read
As a free and powerful web analytics tool, Google Analytics is the industry-standard tool for tracking website performance. It’s known to be used on over 27,000,000 live websites. However, just installing the GA tracking code isn’t enough, you won’t have scratched the surface in discovering the full potential of Google analytics.
Most marketers have used Google Analytics and many have a basic understanding of how Google’s analytics service can inform and improve their digital marketing. However, like any complex system, there are many improvements you can make when trying to implement, configure, optimize and extend your use of Google Analytics.
Jump to a section
1. Not creating a measurement plan
What is it
In a nutshell, a measurement plan is a document that translates your top-line business objectives into metrics and dimensions you can measure on your website.
Why is it useful
It provides a framework not only for a customised configuration of your web analytics but also forms a vital part of your wider digital marketing strategy. This then determines how your digital channels best play together to achieve your KPIs.
The creation of a measurement framework is one of the core elements of an advanced configuration of Google Analytics, usually preceded by an audit of the current setup.
How to start
Many good blog posts have been written on this subject (one worth reading is Avinash Kaushik’s post). Crazy Egg also offers a useful step by step guide.
You need to consider what information you need and how frequently you need it to stay on top of what’s happening on your website.
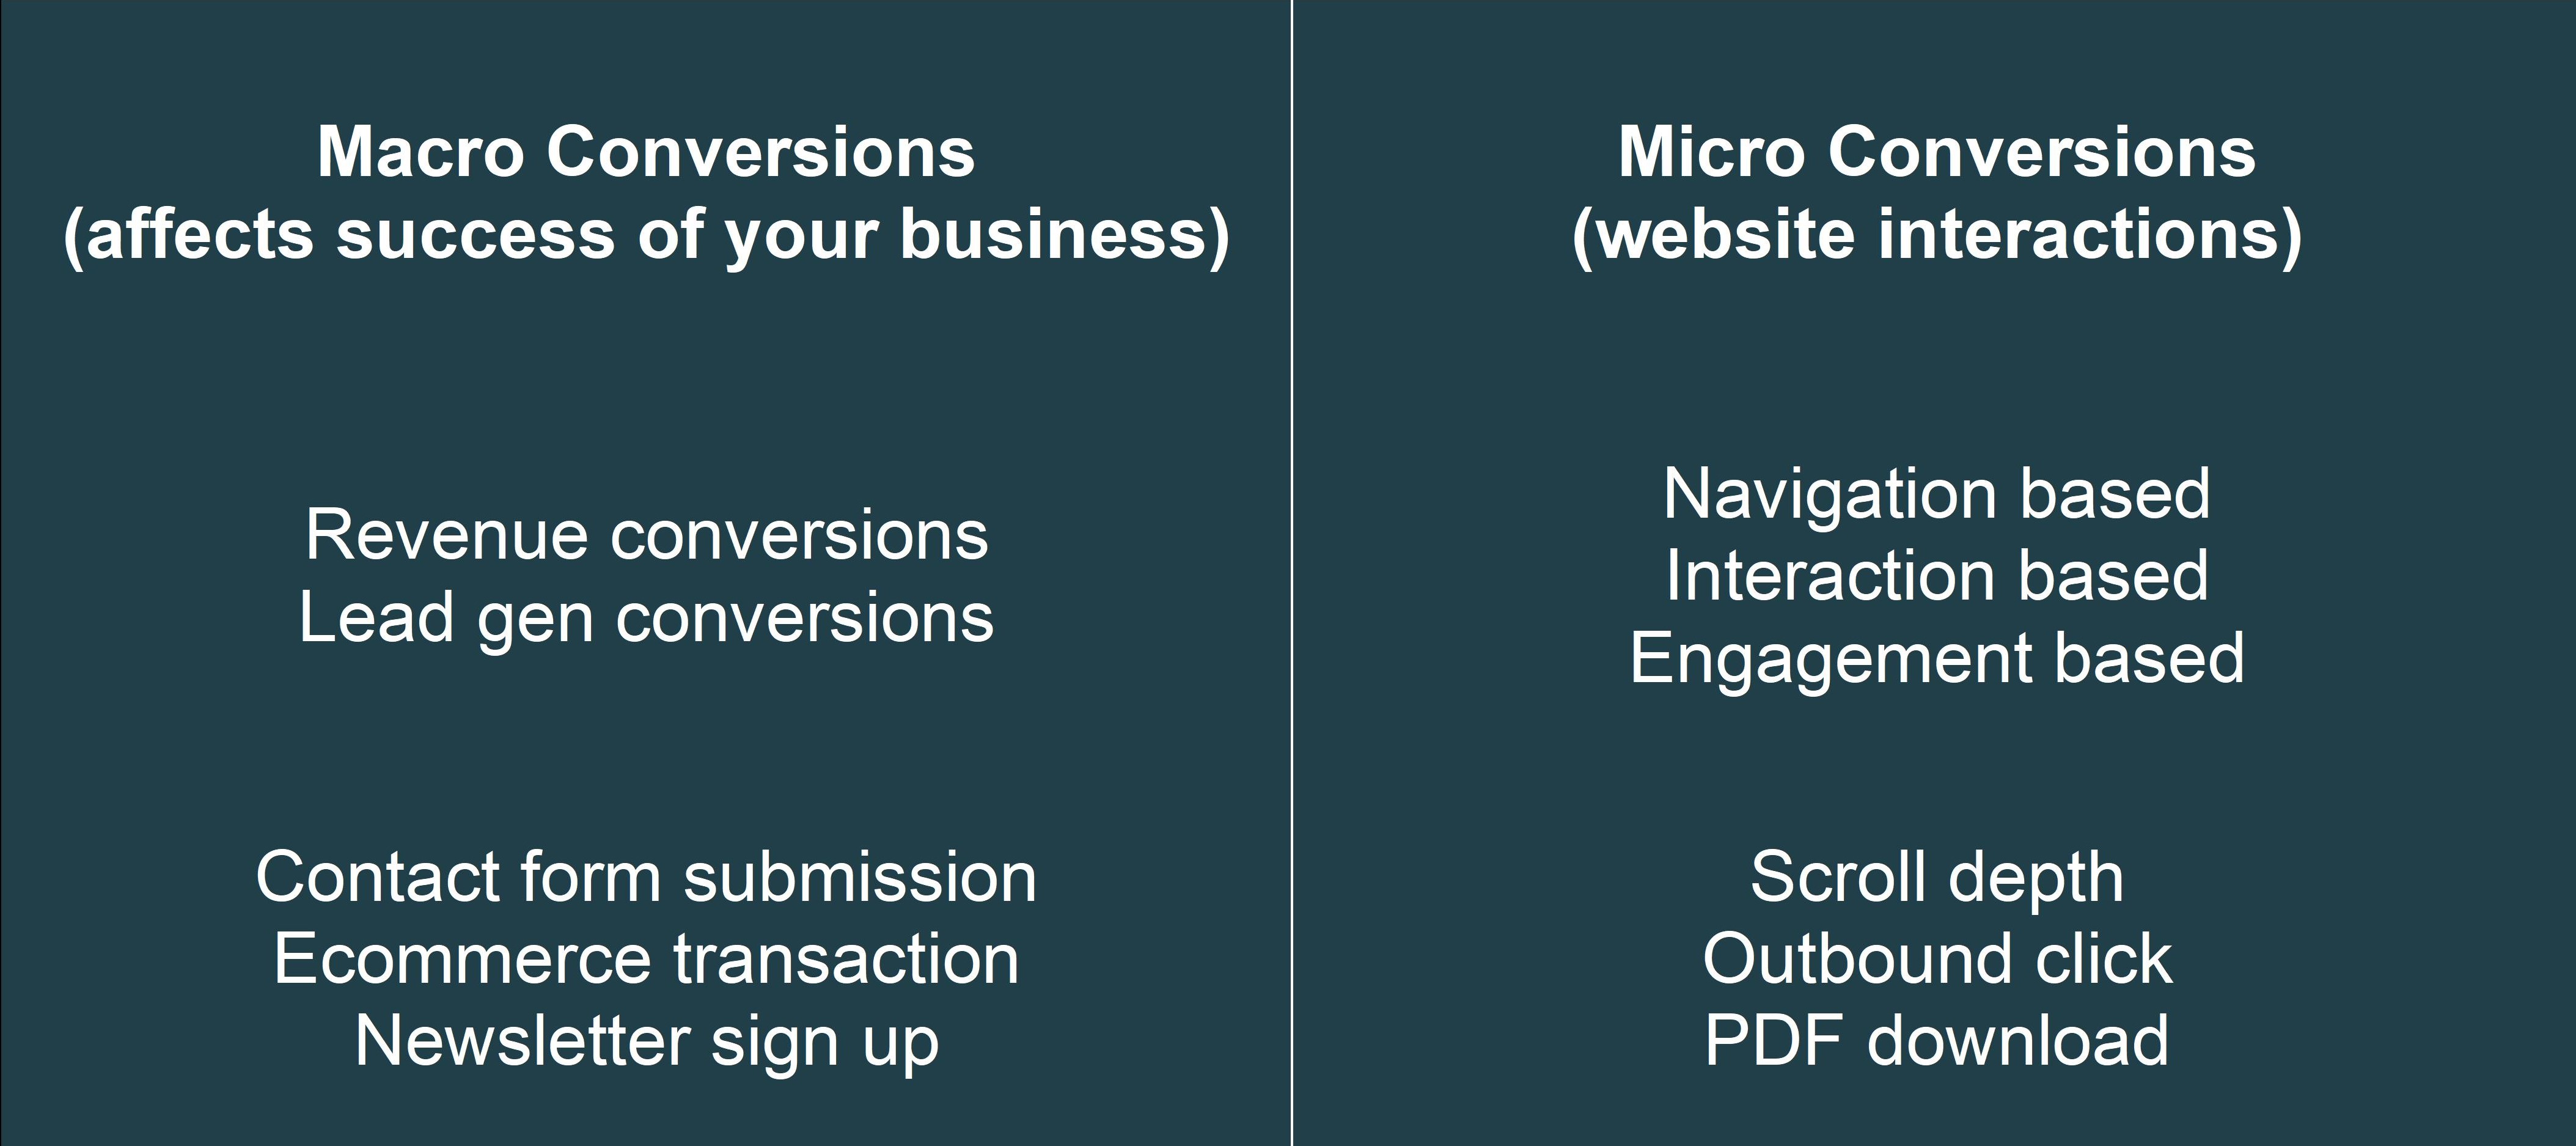
A simple starting point is to understand macro and micro conversions.
A macro conversion is what you traditionally think of when you hear the word “conversion”. Macro conversions should be something where a user has taken an action – they’ve completed a form, made a purchase or downloaded an asset. Don’t set a macro conversion based on a simple page visit.
A micro conversion, on the other hand, is an action that a user can take that brings them closer to the macro conversion on their digital journey. This means that most micro conversions are indicators of interest.
2. Not using Google Tag Manager
What is it
Google Tag Manager is a free tool that allows you to manage and deploy marketing tags (snippets of code or tracking pixels) on your website (or mobile app) without having to modify the website code.
Why is it useful
Using Google Tag Manager, you can deploy different types of tracking codes (tags) such as the Google Analytics tracking code on your site without asking a developer to edit your website code. Similarly, you can add codes for event tracking, conversion tracking, remarketing, and more using the Tag Manager.
Through the tag manager, you can enhance the data within Google Analytics and easily implement and effectively measure the macro and micro metrics outlined in the measurement plan. It also means you can quickly add other tracking codes like Hotjar or Facebook Pixel.
How to start
Google Tag Manager can seem a complex tool, but there are loads of resources available on the web that provide an overview of the first steps. Switching tracking codes and setting up a Google Analytics page view tracking is the first stage. There is a great video series by Measure school which outlines how to do this.
Google Tag Manager support
If you’re not confident with Google Tag Manager then we’re happy to help you get set up
3. Not tracking conversion and events
What is it
Google Analytics goals and events can be used to measure actions on your site that directly affect the success of your business. Google Analytics is built upon the concept of conversions. Its menu system and core reports are ordered around the ABC model – Acquisition, Behaviour, Conversion.
![]()
Why is it useful
Adding conversion tracking and event tracking will enable you to add clarity as to whether your marketing efforts are working. Proving your progress with data on what is/is not working on your website.
As outlined a conversion should be something a user has worked hard at doing – they’ve completed a form, made a purchase or downloaded an asset (when signed in). Don’t set a conversion based on a simple page visit.
Google Analytics events are different because they track simple interactions on your website that may or may not affect your bottom line. For instance, PDF or brochure downloads, button clicks, outbound link clicks etc.
How to start
If you’ve switched the standard Google Analytics tracking into Google Tag Manager then setting up events and conversions should be relatively straight forward. Again you should have a measurement plan in place to determine what actions are the priority to measure in Google Analytics.
This guide will show you how to set up events via Google Tag Manager.
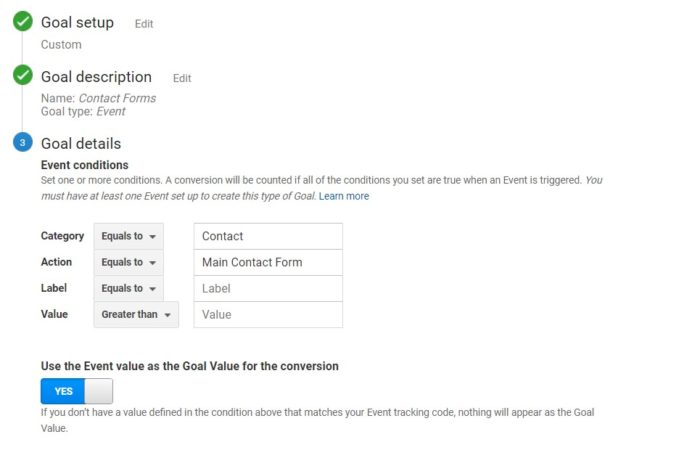
An Event has the following components. An Event hit includes a value for each component, and these values are displayed in your reports.
- Category
- Action
- Label (optional, but recommended)
- Value (optional)
From these events, you can set up event goals within Google Analytics.
4. Not setting up views & filters
What is it
A view or reporting view is a subset of an Analytics account property that can have its own unique configuration settings. You can create multiple views for a single property.
Why is it useful
You can use filters to customize views and see only a subset of data in your reports. You might, for example, have one view to filter out all internal traffic, and another to include only activity from a specific website directory or subdomain. This makes it easier to segment and report on website performance.
How to start
Here is an important rule of thumb: always create at least three Google Analytics views in your account:
- Master View
- Test View
- Raw Data View
The Master View is your working view. It means that you usually apply many different filters and some other modifications to get the most accurate and actionable data in your view.
The Test View as the name already implies – as a testing environment. This is where you test all of your filters first. Of course, you could always skip testing a filter, but even experienced users should refrain from doing this.
The Raw Data view is an untouched view where you don’t apply any modifications (like filters) that alter the data collection process. This view allows you to always go back if anything goes wrong in your working view(s).
Once you completed that you can move onto moving advanced uses including target market views, traffic source views etc.
5. Not activating Google Signals
What is it
First announced in July 2018, Google Signals is the name given to the Google product that enables cross-device reporting and remarketing. Enabling Google Signals allows you to take advantage of new and improved advertising and reporting features across different devices.
Why is it useful
When you activate Google Signals, existing Google Analytics features are upgraded to include more information from Google users, but only for those who have turned on Ads Personalization.
These are the areas where more information is gathered when Google Signals is activated (but only for users with Ads Personalization enabled):
- Remarketing – this extends any eligible remarketing activities to work cross-device
- Ads reporting – you’ll get more information about users
- Demographics and interest reports – more information will be collected
- Cross-device reports (in beta) – you will start to see cross-device information in your account
How to start
The collection of the information only starts from when you activate the information, so if you want to make use of it, you should activate it as soon as possible.
- Sign in to Google Analytics.
- Click “get started” in the blue notification banner at the top of the page, or navigate to Property column > Tracking info > Data Collection and follow the prompt in the blue dialogue.
- Click through the information and activation panels.
- Read the information about Google signals, then click “CONTINUE.”
- Activate Google signals.
6. Not tracking site searches
What is it
If your website has a site search feature then you should set up site search tracking in Google Analytics.
Why is it useful
By connecting your Google Analytics account to your internal site search you can start collecting a list of every keyword people search for on your site. You’ll understand exactly what users think is missing and what they have trouble finding.
There are many uses for this report. Some examples include:
- How many pages it took for people to find what they wanted
- How persistent visitors were with their query, by how many pages of results they looked through
- Most common queries
- Trends and identifying new searches which can help you identify products to stock or content to write about
- Identifying common misspellings or other ways to phrase something
- Which areas of the site people choose to search for over navigating through a menu for
- Which queries lead to users being engaged with the website
- Queries that have good conversion rates
How to get started
Site Search must be set up for each reporting view in which you want to report on user search activity.
- In Google Analytics click Admin, and navigate to the view in which you want to set up Site Search.
- In the View column, click View Settings.
- Under Site Search Settings, set Site Search Tracking to ON.
- In the Query Parameter field, enter the word or words that designate internal query parameters, such as term, search, query, keywords. Sometimes query parameters are designated by just a letter, such as s or q.
- Select whether or not you want Analytics to strip the query parameter from your URL. This strips only the parameters you provided and not any other parameters in the same URL.
If you leave categories OFF, you are finished. Click Save.
![]()
7. Not syncing with other Google platforms (Google Ads / Search Console)
What is it
Platforms like Google Ads and Google Search console can easily sync with Google Analytics enabling you to enhance your website analytics.
Why is it useful
Linking your Google Search Console and Google Ads account to your Analytics property enables the sharp marketer to get a more complete view of how users interact with your marketing. If you have these platforms but haven’t linked them, then you are missing on valuable insights into your website and business as a whole.
- Google Search Console allows you to monitor your site’s presence in Google’s search results. You can connect your Google Analytics account with Google Search Console, so you can easily analyze your SEO rankings for most search queries and landing pages along with a range of other informative data.
- Link your Google Ads and Google Analytics accounts today to get the full picture of user behaviour and discover how to optimize your campaigns and improve the performance of your website/business. It also enables you to import conversions goals and user behaviour into Google Ads.
How to start
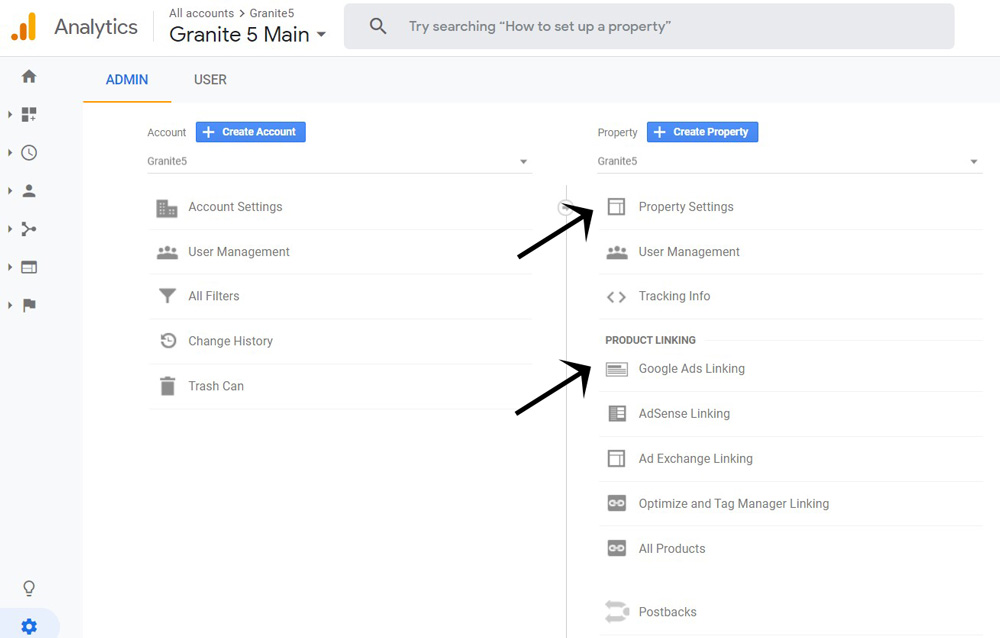
Both platforms can be linked to from the property section of Google Analytics. Make sure you are using the same Google account for the platforms you want to sync.
Enable Search Console data sharing
- In the PROPERTY column, click Property Settings.
- Scroll down to Search Console Settings. You should see the URL of your website, which confirms that the website is verified in Search Console and that you have permission to make changes. If you do not see the URL, you need to add your site to Search Console.
- Under the Search Console, select the reporting view(s) in which you want to see Search Console data.
- Click Save.
- Under property, click AdWords linking
- Click + New Link Group
- Select the accounts you want to link
- Enter your Link Group Title
- Switch on all sites where you want Google Ads data
- Click link accounts
8. Not using Google data studio
What is it
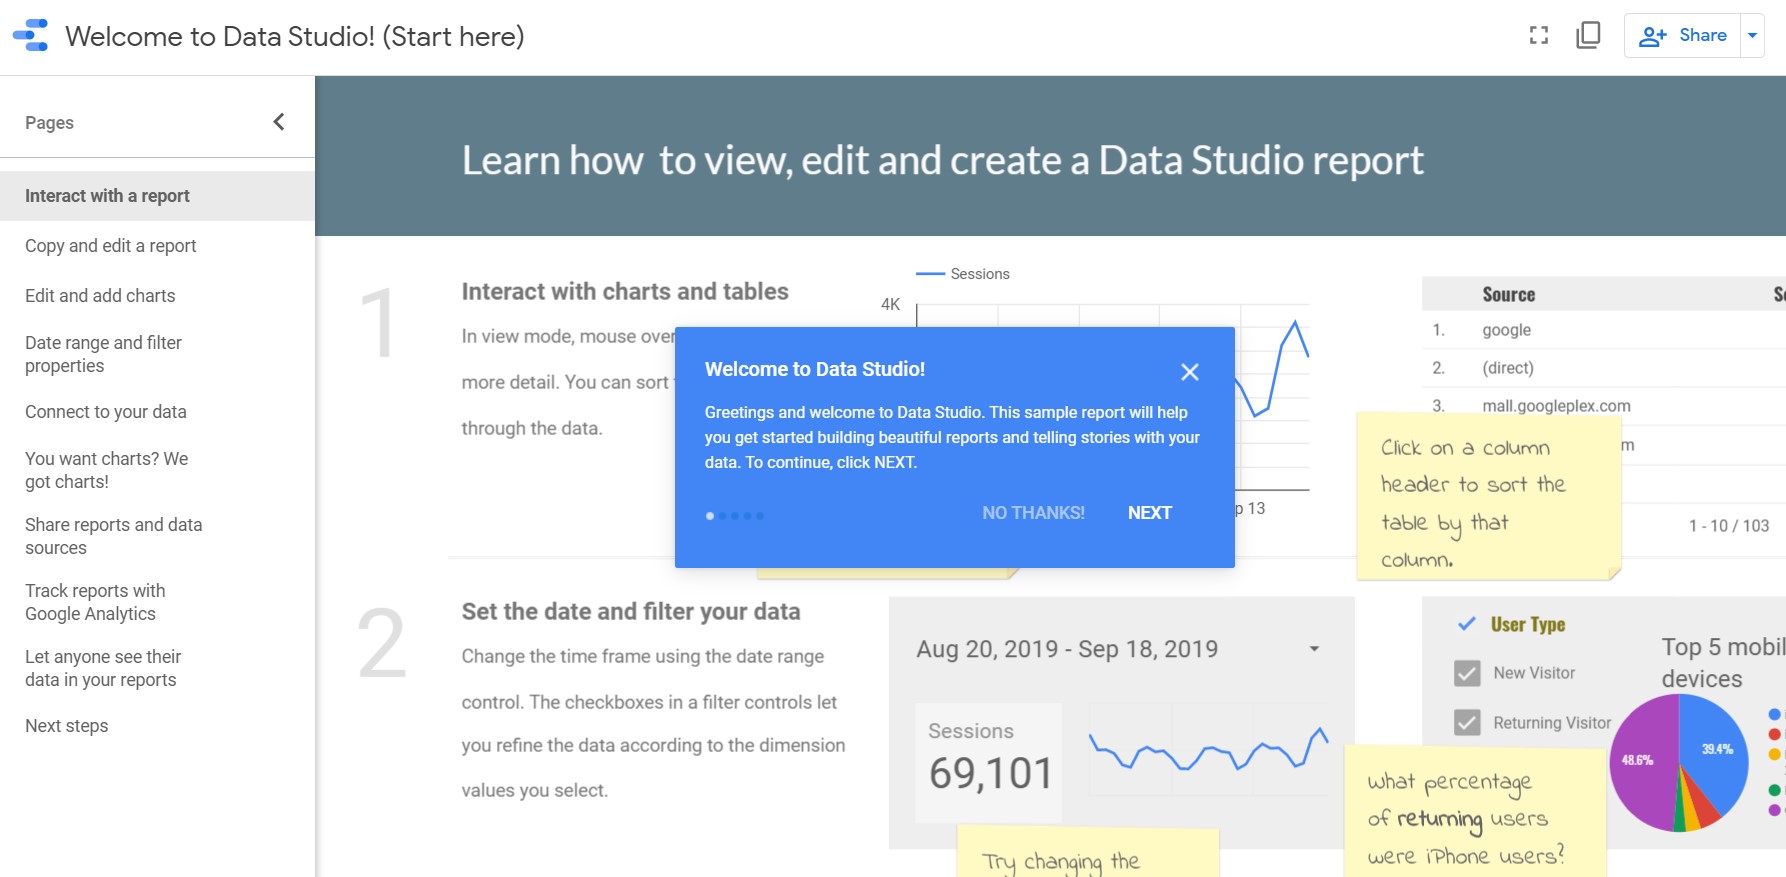
Google Data Studio is a free dashboard and reporting tool that is easy to use, customise, and share. It allows you to transform your data into appealing and informative reports for your audience.
Why is it useful
Data Studio turns your data into informative, easy to read, easy to share, and fully customizable dashboards and reports. Use the drag and drop report editor to:
- Tell your data story with charts – Making an interactive report with view filters and date range controls. The data control turns any report into a flexible template report that anyone can use to see their data.
- Annotate and brand your reports with text and images and include links and clickable images. Apply styles and colour themes that make your data stories works of data visualization art.
- Connect to your data – With Data Studio, you can easily report on data from a wide variety of sources, without programming. You can connect to data sets such as Google Marketing Platform products (Google Ads, Analytics), Google consumer (Sheets, Search Console) and social media platforms (Facebook, LinkedIn, and Twitter).
- Share and collaborate – It’s easy to share your insights with individuals, teams, or the world. Invite others to view or edit your reports, or send them links in scheduled emails. To tell your data stories as broadly as possible, you can embed your reports in other pages, such as Google Sites, blog posts, marketing articles, and annual reports.
How to start
Google provides several templates to get you started and a tutorial report. There’s also a guide to get you started.
The is also a learn how to view, edit and create in an interactive report.
Remember – Google Analytics doesn’t tell you “why?”
Google Analytics can’t tell you why for example 85% of sessions land and bounce off your sales page. That’s your job.


